SAP Business Objects Lumira on SAP HANA
Welcome one and all to another reporting on HANA tutorial. In this one, we try to the understand the SAP Business Objects Lumira. Like Explorer, it is a data exploration tool. Lumira opens up avenues of data exploration like never before. It now allows a business user to not rely on their IT developers to create create reports for them whenever they wish to do some slice and dice data exploration.
Explorer had it’s limitations wherein the business user still needed someone to create an information space first which created a dependency on IT. But lumira users can connect to HANA views directly by themselves and use it for building reports. Lumira, unlike explorer also allows the user to do transformations to data in order to cleanse the dataset as per the user’s demand. It is a really powerful tool and is one of SAP’s best offering currently in this use case. The tool is also optimized to run with the SAP HANA database. So it’s great with respect to performance too.
Note: In Mid-2017, SAP plans to provide a single solution combining the data exploration capabilities of lumira and the dashboarding capabilities of SAP Design Studio (It’s in our next tutorial.. just in case you don’t know about it). This tool will be called Lumira 2.x which will have 2 components – Lumira Discovery (for data exploration) and Lumira Designer (for dashboards).
SAP Business Objects Lumira Key Points
Report Complexity: Medium
Report Users: End Users/Business Users/Business Analysts
Report Type: Data Discovery
Frequency of use in realtime projects: Medium-High
Effort to develop: Medium
Creating our first SAP Business Objects Lumira Visualization
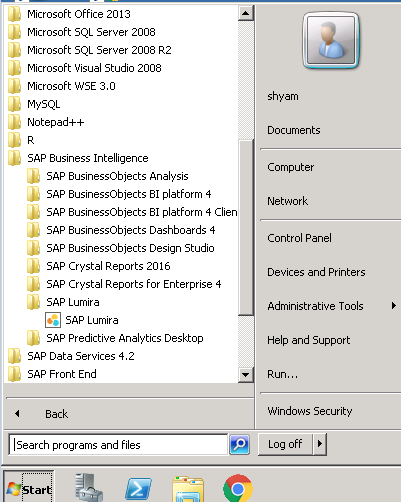
You can find lumira under your SAP Business Intelligence Folder and SAP Lumira sub folder in the start menu. Click on it to open.
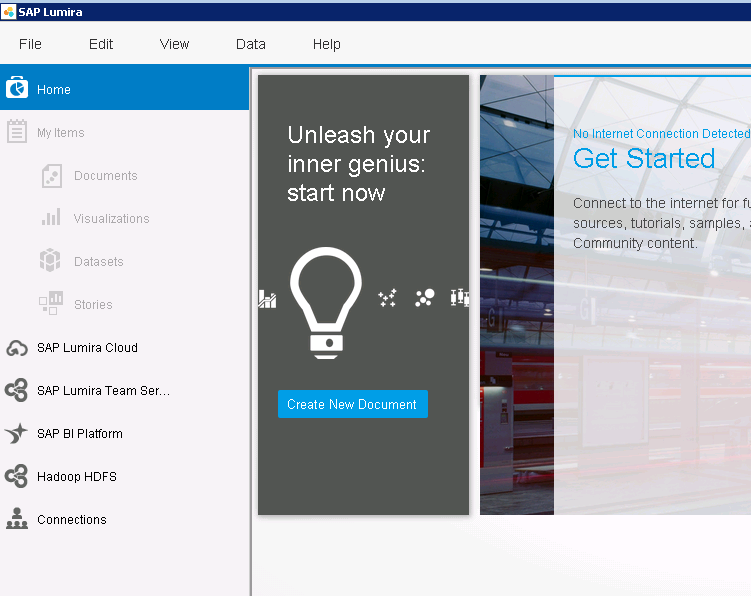
A beautiful window opens up to start the application… Wait for it.
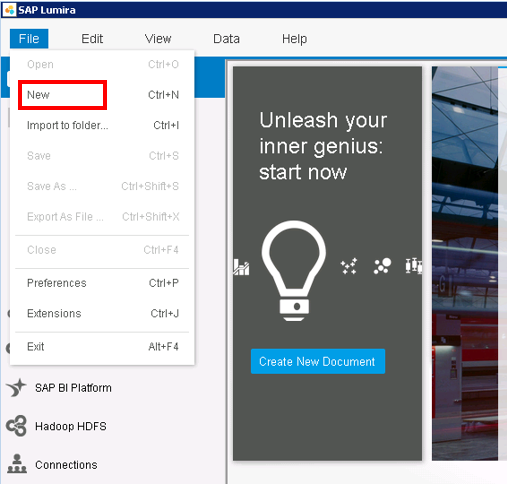
The tool opens as below. Click on File from the context menu.
Click on New to start creating a new report.
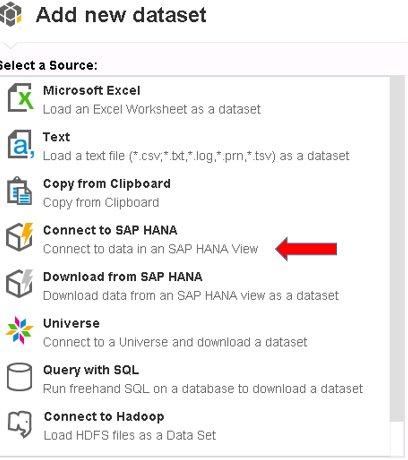
The next step would now ask you for the source of your data.
Select the “Connect to SAP HANA” option.
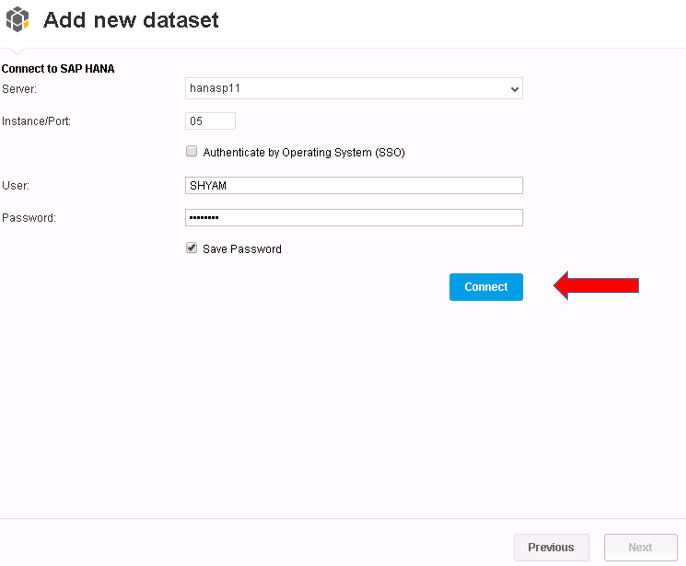
In the next step, you would be asked to provide the connection details to this HANA system where you wish to source data from. Contact your system administrator if you are unaware of the details to provide here. 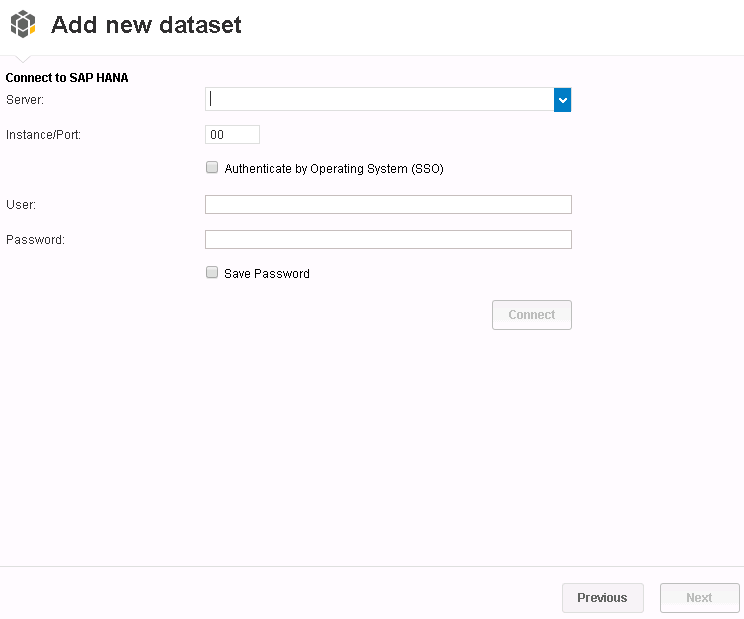
I’ve provided the details for my system below.
Once done, press Connect.
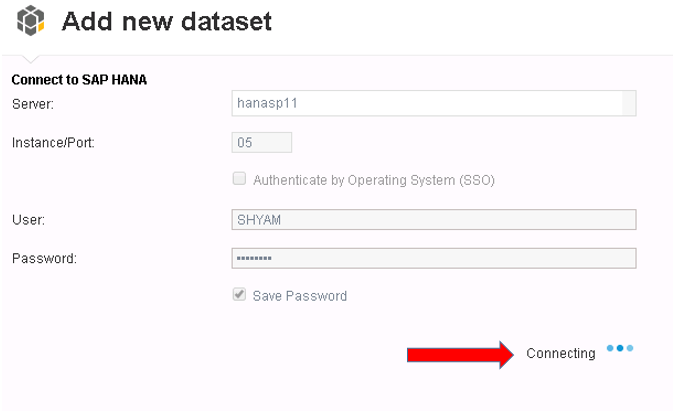
The Connecting.. sign would indicate that the connection is being established.
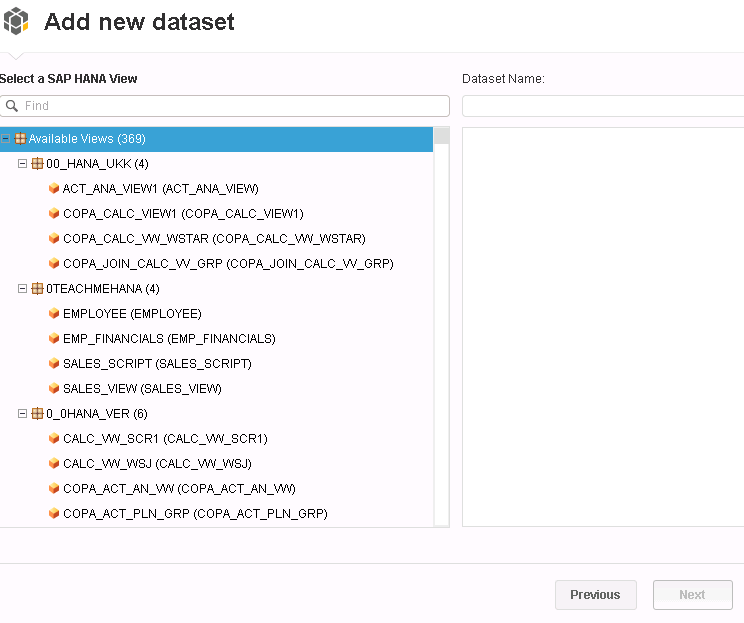
Once connected, the below screen opens up which displays all the available packages the user can see in the HANA system. These packages contain the information views which would act as source of data for the Lumira reports.
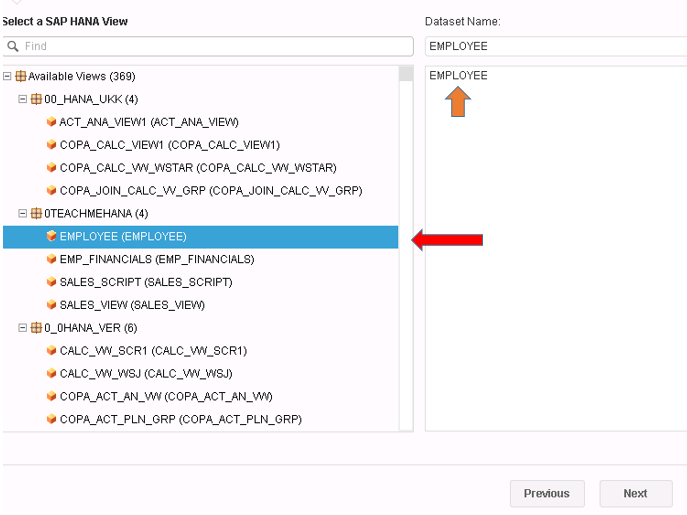
As seen below, we have our 0TEACHMEHANA package which houses all the views we created earlier in the tutorial
Let’s create our view on the EMPLOYEE view. Double click on this view inside of the 0TEACHMEHANA package. As soon as you do this, it also appears on the right pane.
Press Next.
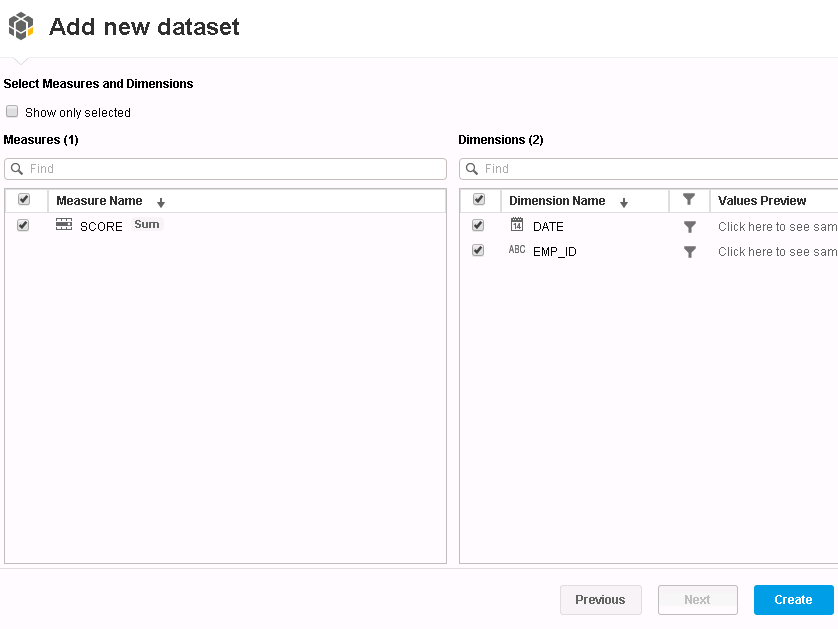
In the next step, we select the dimensions and measures required to build the report we need. Since we have only 3 fields, let’s take all of them. Mark all the checkboxes to select as shown below.
Press the Create button when done.
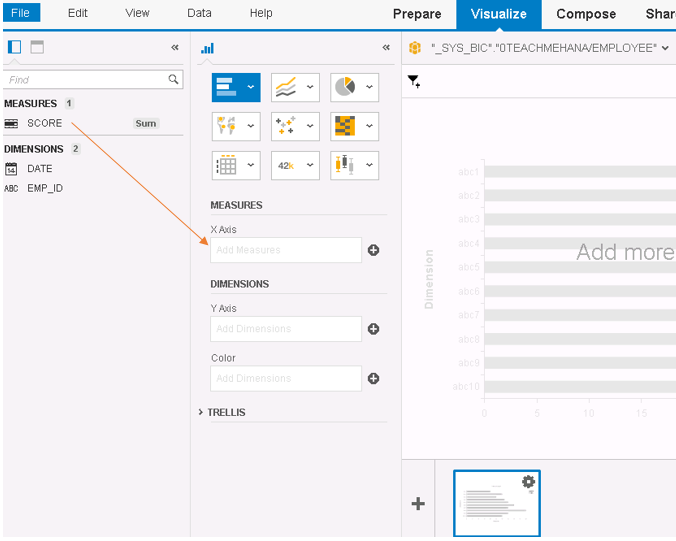
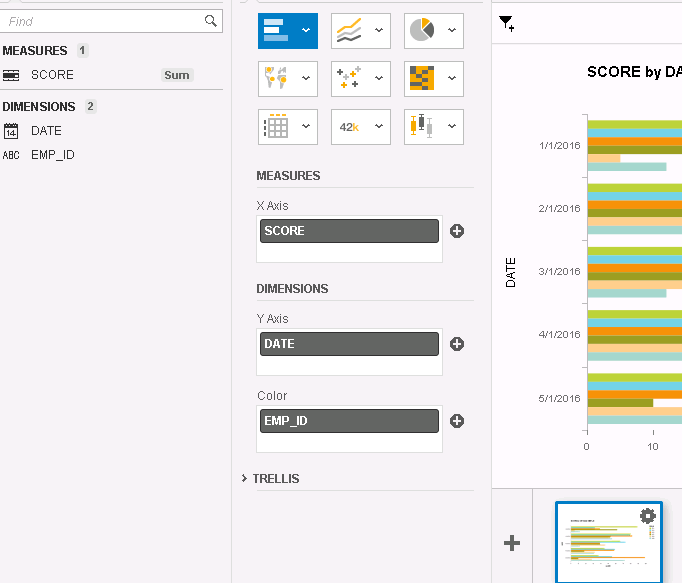
Like most other BO reports, on the left side you have the list of all fields now available to go into the report. In the middle, you have the chart selector which where you would provide the type of chart you wish to create and. On the right, what you have is the output of this report that was built.
Thus, you can see your report output change, as you are building it.
If you are familiar with graphs or charts or even basic mathematics, you would know that on a 2-dimensional plane, you have an X-Axis and a Y-Axis.
Pull the field you wish to see on the X-Axis of the report to the X-Axis field.
In this example, we pull the field SCORE to the X-Axis as shown below.
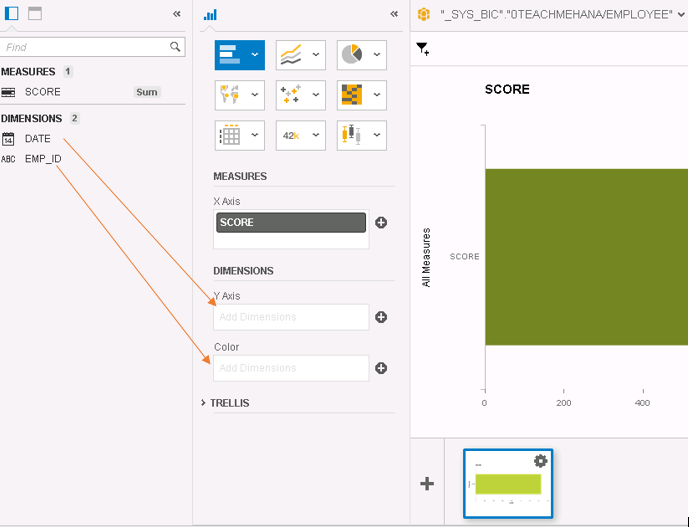
Now, we need to decide what goes on the Y-Axis. Let’s analyze SCORE by DATE. Pull in DATE to Y-Axis. We have another field called “Color”. Let’s pull employee ID (EMP_ID) into here. This will ensure that the data splits into different colors for each EMP_ID for each unique DATE.
Once these fields are in in, it should look as below.
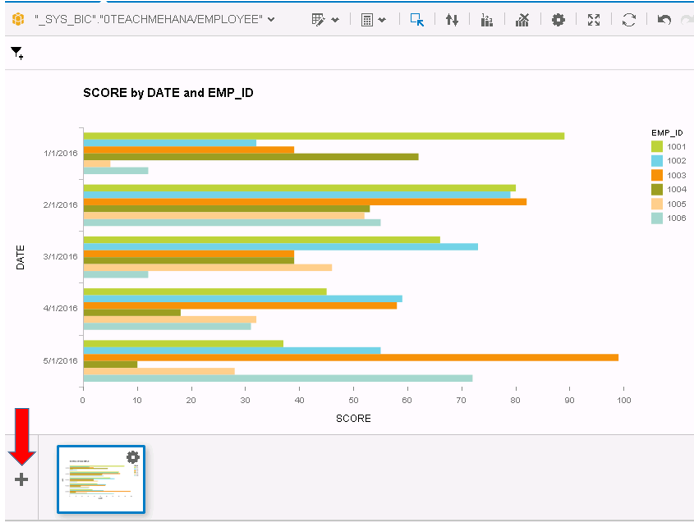
On the right side of this screen would also be the output of this report.
As seen below, the SCORE is on the X axis, DATE and EMP_ID on the Y axis slip into different colors based on the EMP_ID.
This was our very first Lumira visualization. Another interesting feature is that you can do more analysis in fresh visualizations by pressing the Plus button marked below. It would add a fresh new report as a new page below.
Let’s try it out. Press Plus.
Proceed to the next page to read more.

Great work ! Explained very well . Even i have going through lots of blogs none of them explain in detail as you.
Keep going .Could you please post as well on BW 4 HANA
Hi,
Thanks! You came in really early. I am still adding the navigation buttons on these posts :). Probably a bug in the system sent out the alerts to users. But anyways.. thanks for the kind words. Please share a few tutorials on social media to support the site. I will write on BW4HANA and will keep everyone informed via mails when it starts,
Really good material for beginners and well described.
Thanks. Please share a tutorial to spread the word.