SAP BO Explorer on SAP HANA – Part 2
Welcome back to the second part tutorial on SAP BO Explorer on SAP HANA. If you have reached this page directly, please read the Part 1 tutorial first before proceeding further.
SAP BO Explorer Contd..
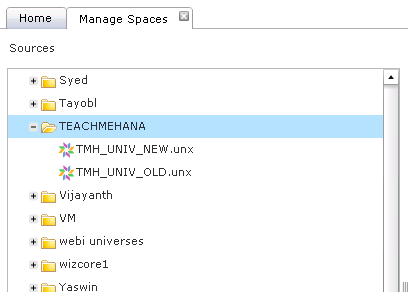
Find the folder under which they were published and expand it. As seen below, we have both the universes we published last time.
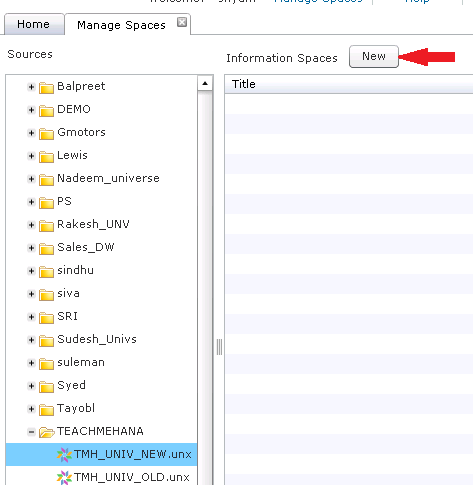
Here, we choose one – TMH_UNIV_NEW and press the “New” button marked in red below.
This tells the system that we need a new information space built on this universe.
If you chose the relational connection method instead, you would have to click on your view name and click on the “New”button.
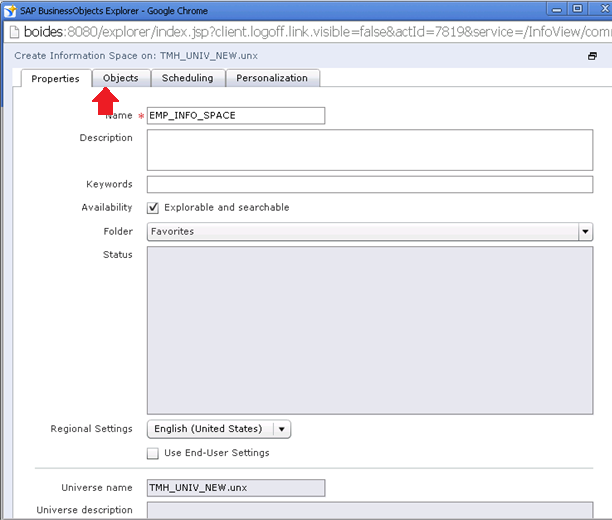
Give the Information space a meaningful name. Since the universe we chose was built on the employee view, we provide the name EMP_INFO_SPACE.
Now, switch to the Objects tab.
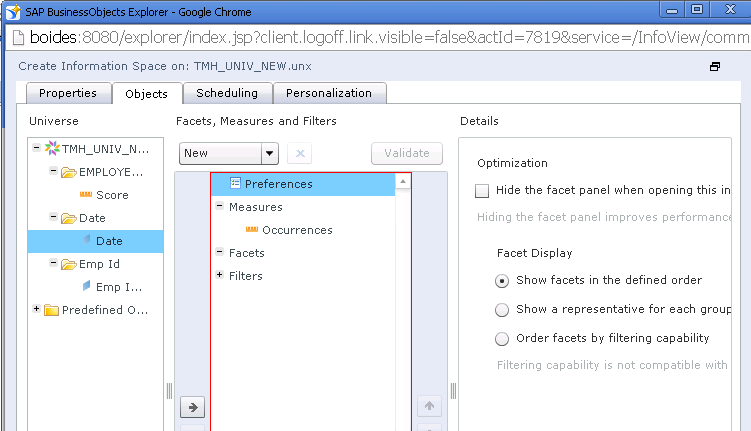
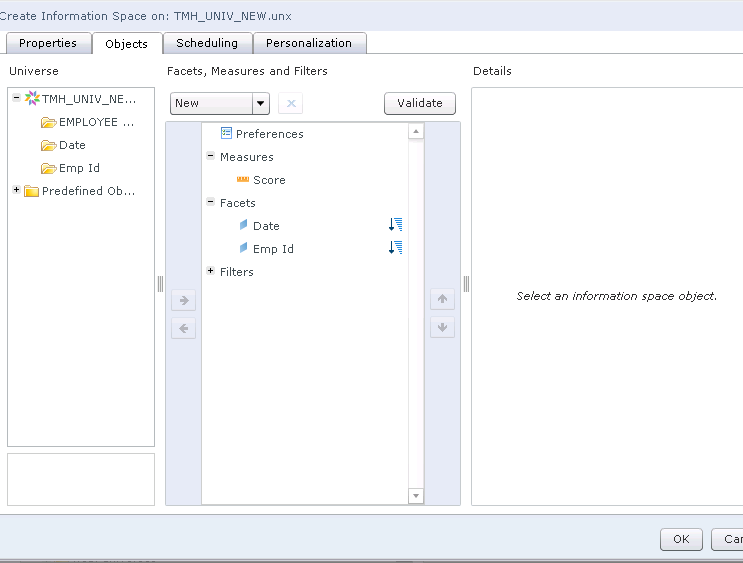
This is the main area where you define the measures and facets (=dimensions/attributes) which you need to be part of your explorer report.
By default, a measure called “Occurrences” – it would count the number of rows in your output. We remove it here but you can keep it if you require. Grab and drag it out of the pane to remove it. Similarly, drag and drop the measures and facets from the universe on the left into the right pane to add them to the information space.
Once done, the screen would look like below.
Press Ok when done.
As you see below, the information space has been created. Press the Index now button to index the report data-set.
The indexing process starts and should take a few seconds.
Once done, you get a screen like shown below.
Our information space is now ready to use.
It’s time to switch back to the “Home” tab we were on at the beginning of this tutorial.
Double click on your information space. If you don’t see it in the list, search for the information space you just created in the search bar.
1
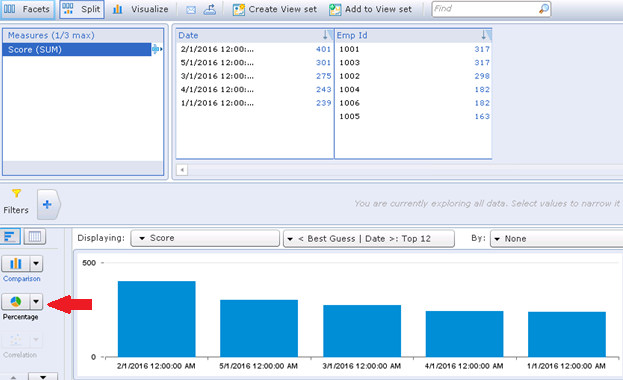
The explorer report opens up as seen below. All the fields you selected in the information space are available here. This default layout can be saved as it is or be changed as per the need.
For example, you can change the chart type from the button marked below.
As seen below, I’ve switched the bar chart into a pie chart.
But there’s not much to do here anymore. Explorer reports are, as explained earlier, a semi-cooked set of ingredients. The user can change chart types, filters, fields, slice and dice the data to understand and analyze this data-set as per his/her need.
I hope you understand how SAP Business Objects Explorer reports are built on top of SAP HANA data models. As always, if you liked what you read, support this website by sharing at least one tutorial on social media.
Until next time..




Hi Sir ,
How to import CV directly to webi in SAP BO4.1 ,Please let me know
Hi Sir,
This site very helpful..Could you please upload session on currency conversion, Input parameters and variables.
Thanks!
Please share a tutorial to support us.
Input Parameters and variables have their own tutorial here. Check them out.
Will do a currency conversion soon.