Analyzing the SAP HANA Calculation View Execution Part – 1
Welcome everyone again to the our next tutorial. In this one, we try to understand where these a calculation view is stored and how they get executed during the data preview functionality.
Things will become cleared as we progress in this tutorial.
Note: If you have reached this page instead to learn how to create a SAP HANA Calculation view – Click here for the Graphical view tutorial and here for the Scripted View tutorial.
SAP HANA Calculation view execution – Deep dive
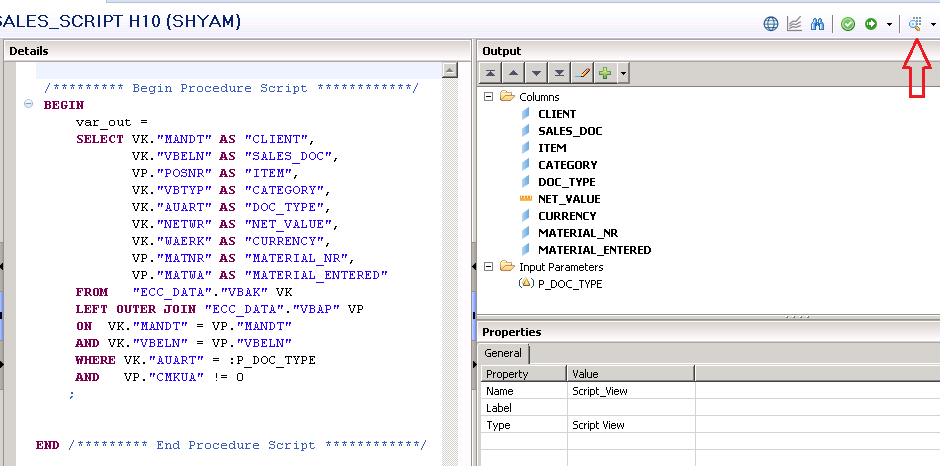
To start off, we continue with the view we created in the previous tutorial. Run the data preview for this calculation view with the same button as always.
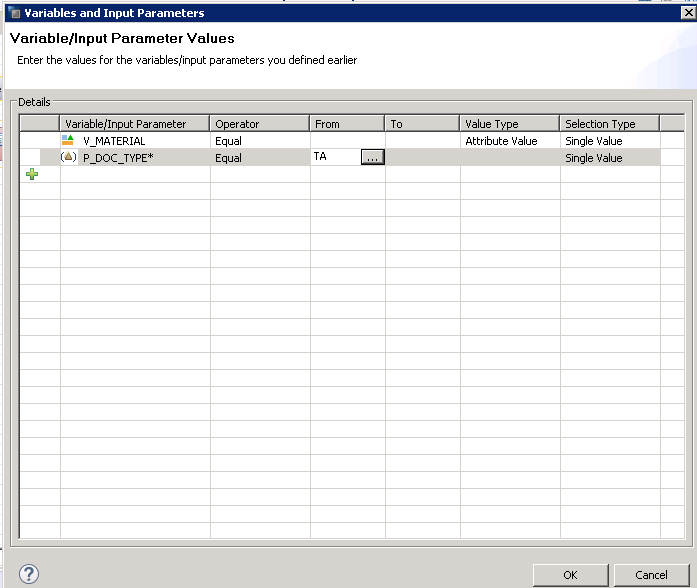
We enter an input parameter for document type as value ‘TA’ and press OK.
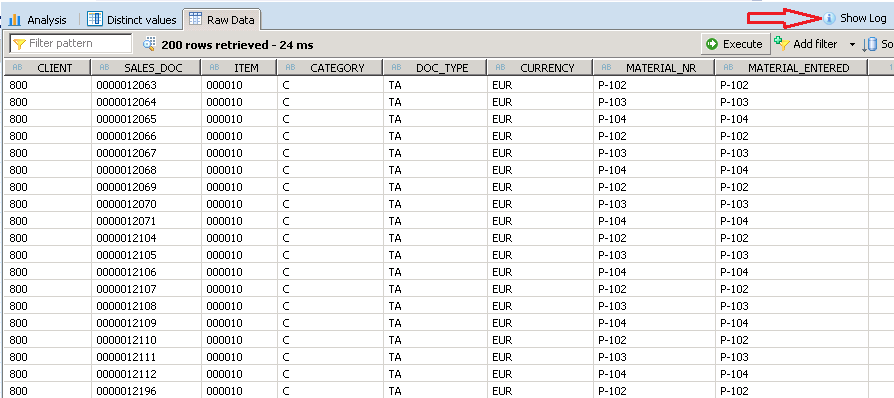
The data preview comes up in the raw data tab as always.
This is where this tutorial truly starts. On the top right, you would see a “Show Log” button Click on this button.
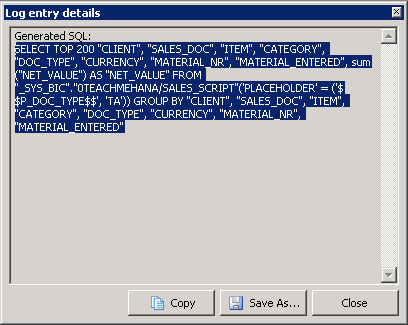
This would open up the data explorer log which provides the step by step execution sequence that went on for this data preview to be shown. Double click on the Generated SQL message.

This provides you the SQL code that was used to call this view. Copy the code starting from the SELECT statement.
Let’s paste this into the SQL editor to get a better picture. Click on the SQL editor button marked below to open it on the right pane and paste the code that was just copied as shown below.

Select the entire code, right click and select “Format” from the context menu to get a properly formatted version of the same code.

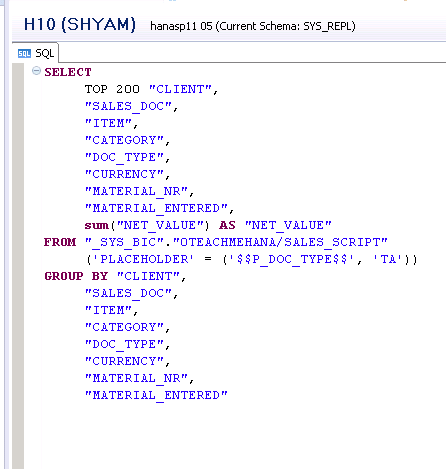
The formatted version of the same code is as shown below. Now, we go step by step understanding what each part of this code means.
1
The first part highlighted below picks up the fields mentioned in the output list of the SELECT statement. As you might have noticed, the raw data preview in a view is usually for 200 rows by default. This is due to the TOP keyword used by the system while calling the view. It’s usually TOP 200 by default.

1
Now, we try to understand where these views are stored and how they get executed during the data preview functionality.
Things will become cleared as we progress in this tutorial.
To start off, we continue with the view we created in the previous example. Run the data preview with the same button as always.

We enter an input parameter for document type as value ‘TA’ and press OK.

The data preview comes up in the raw data tab as always.
This is where this tutorial truly starts. On the top right, you would see a “Show Log” button Click on this button.
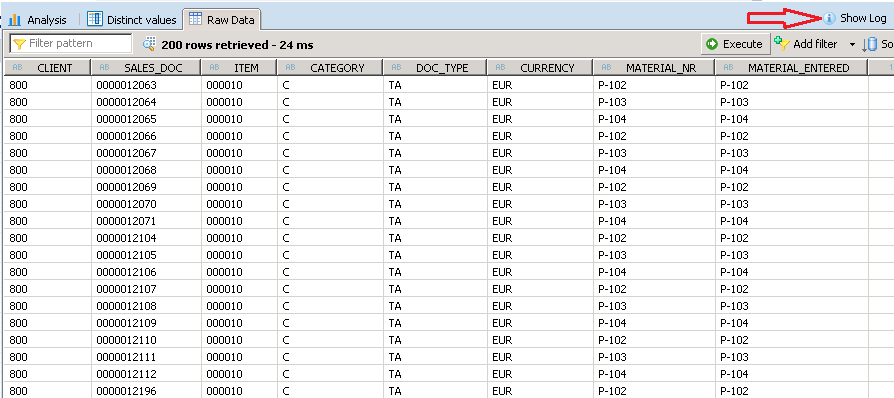
This would open up the data explorer log which provides the step by step execution sequence that went on for this data preview to be shown. Double click on the Generated SQL message.
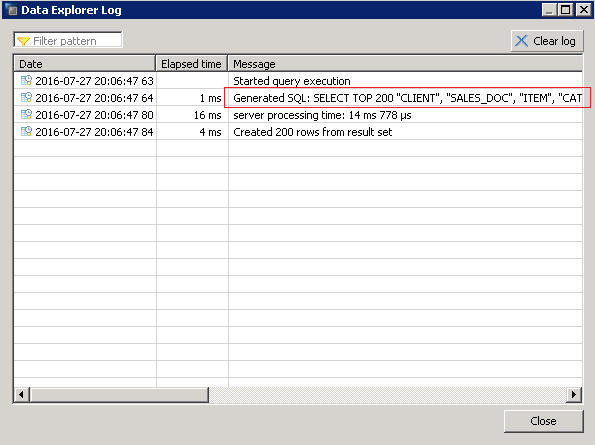
This provides you the SQL code that was used to call this view. Copy the code starting from the SELECT statement.

Let’s paste this into the SQL editor to get a better picture. Click on the SQL editor button marked below to open it on the right pane and paste the code that was just copied as shown below.
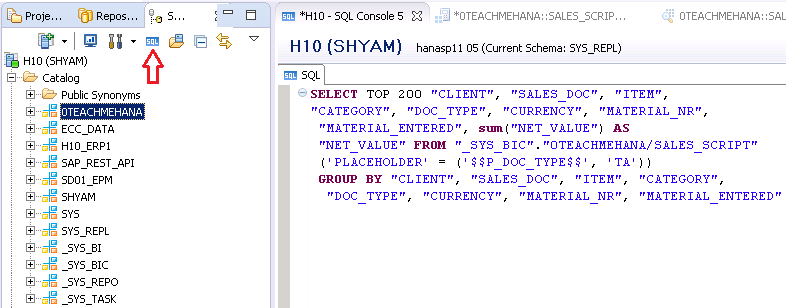
Select the entire code, right click and select “Format” from the context menu to get a properly formatted version of the same code.
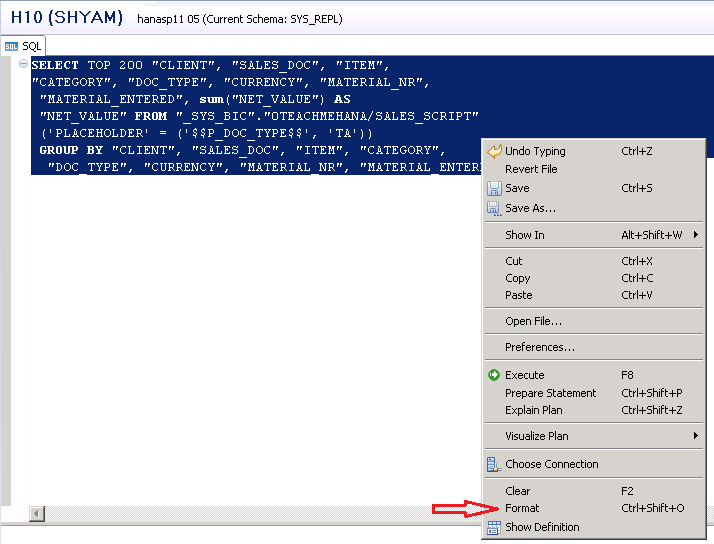
The formatted version of the same code is as shown below. Now, we go step by step understanding what each part of this code means.

The first part highlighted below picks up the fields mentioned in the output list of the SELECT statement. As you might have noticed, the raw data preview in a view is usually for 200 rows by default. This is due to the TOP keyword used by the system while calling the view. It’s usually TOP 200 by default.

Please move on to the next page to continue.

Great tutorials Shyam. Keeps me afloat!. Is the first portion of tutorial repeated on the above page?