MS Excel on HANA Reporting
Welcome to the very first technical tutorial on reporting on HANA. We start off fairly simple. One of the simplest form of reporting most of us would have done is on MS Excel worksheets. There’s usually a tabular data-set on which we can easily create graphs and other analysis as per our requirement. What if we could take that source data-set not from excel but from a HANA view instead? This document takes you through the step by step tutorial on how to achieve Excel on HANA reporting.
Excel on HANA Key Points
Report Complexity: Simple
Report Users: End Users/Business Users
Report Type: Analysis/Data Discovery
Frequency of use in real-time projects: Rare/Low
Effort to develop: Low
Calculation View reporting with Excel on HANA
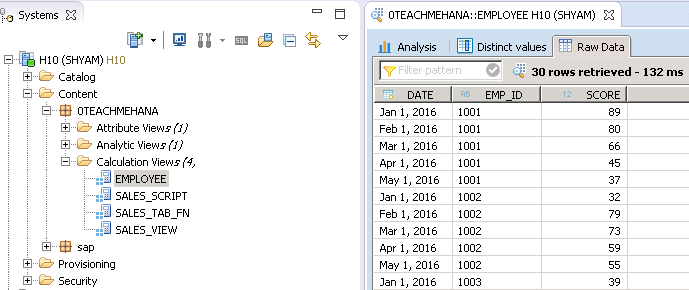
Let’s take one of our views which we created in our earlier sections – The EMPLOYEE calculation view. The data preview is shown as below. It has data for some employee scores taken on the first day of each month from Jan to May 2016.
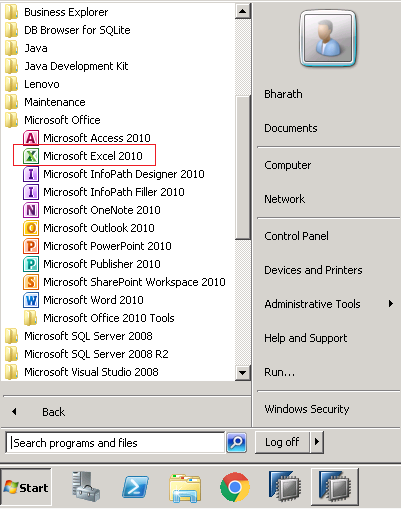
The first step to reporting with Excel on HANA is obviously opening MS Excel. You can find it in your list of programs in the start menu as shown below.
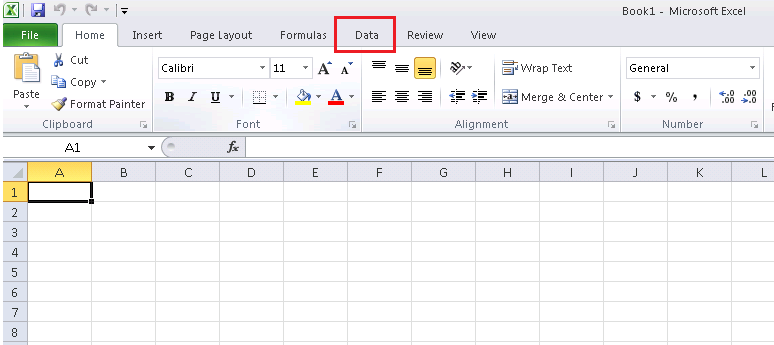
Once it opens, switch to the data tab as marked below.
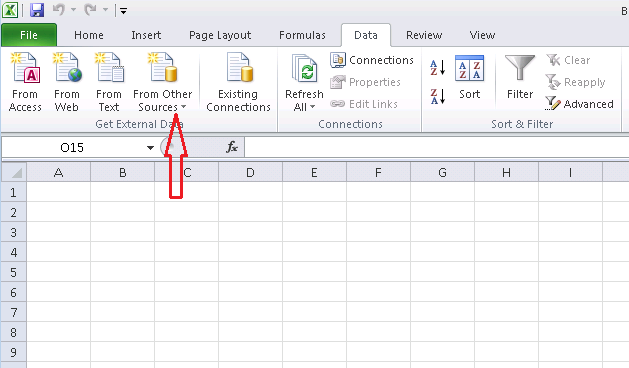
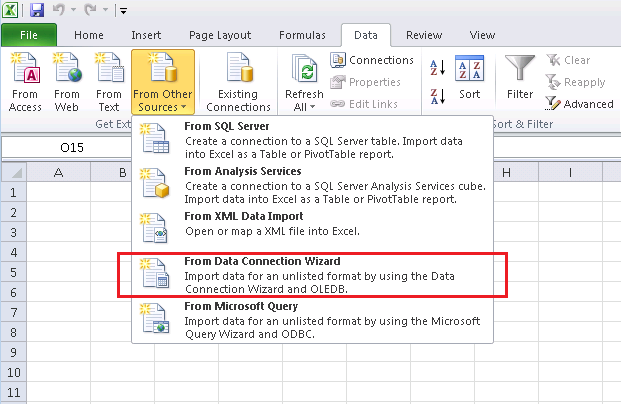
In this tab, we can tell MS Excel where our data needs to come from. Click on the “From Other Sources” button as marked below.
This drops down a list of options. Click on the “From Data Connection Wizard” as marked.
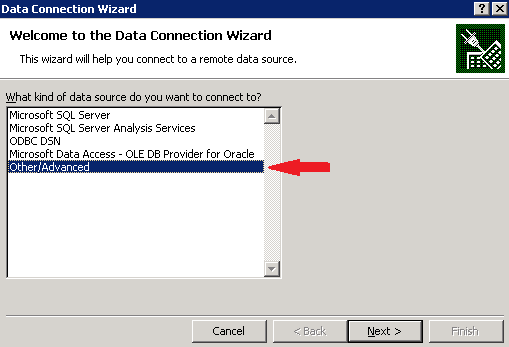
This would open up a “Data Connection Wizard” window. Click on the “Other/Advanced” Data source and click Next.
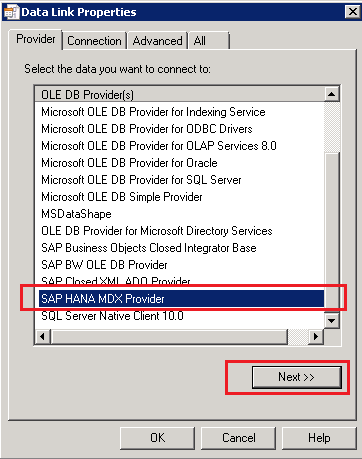
This provides a list of standard connectors which MS Excel has to different databases. Thankfully, SAP HANA is also one of them. Choose the SAP HANA MDX Provider as shown below. And press Next.
1
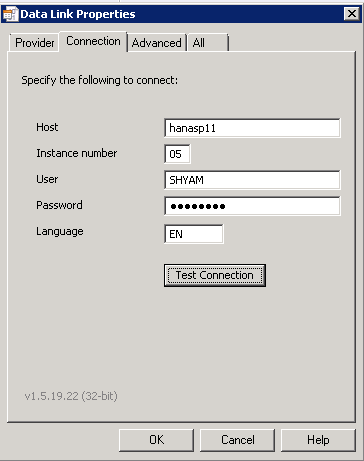
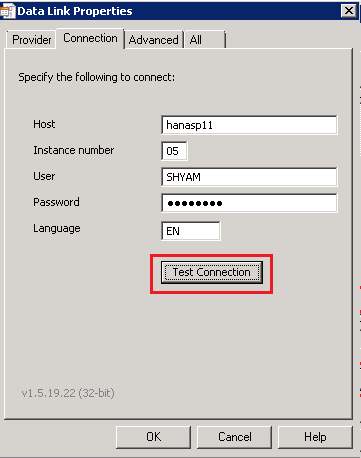
At the next tab – “Connection”, we would need to provide our SAP HANA system details along with the login credentials that would be used to access this view. Ideally, you would already know this. If not, please check with your system admin for these credentials. Click on “Test Connection” to check if MS Excel could successfully connect to your HANA system with these credentials.
If successful, you would get the below information message confirming the connection check.
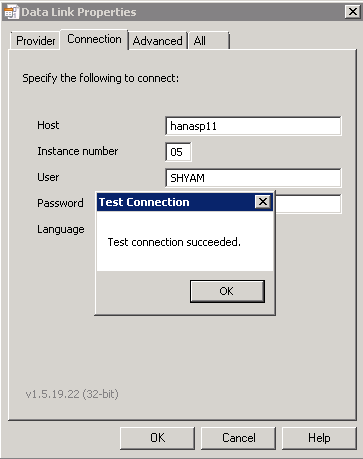
Once it’s confirmed that the connection works fine, click OK to finish the setup.
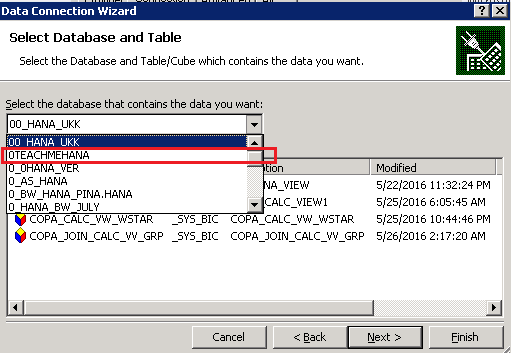
This now brings us to a drop down list where it asks us to select “Database” which contains the data we want. Here the “Database” is our SAP HANA package under which our view exists. Drop down the list and navigate to the package that contains your SAP HANA view.
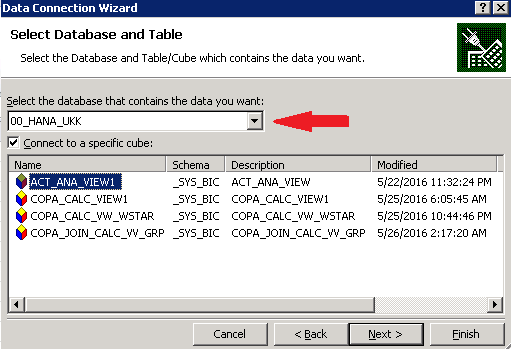
As seen below, our 0TEACHMEHANA package was found. Click on it to select it.
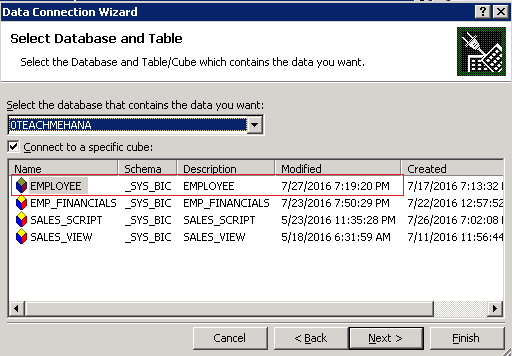
This brings up the list of views under your package. Choose the view you wish to analyze and click “Next”
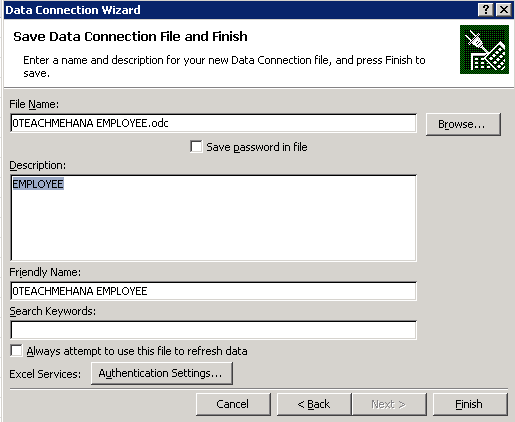
This is the final step of creating the connection file or the “.odc” file. It autogenerates a file name and description for this file which you can change if you so which to. Press Finish to create this connection.
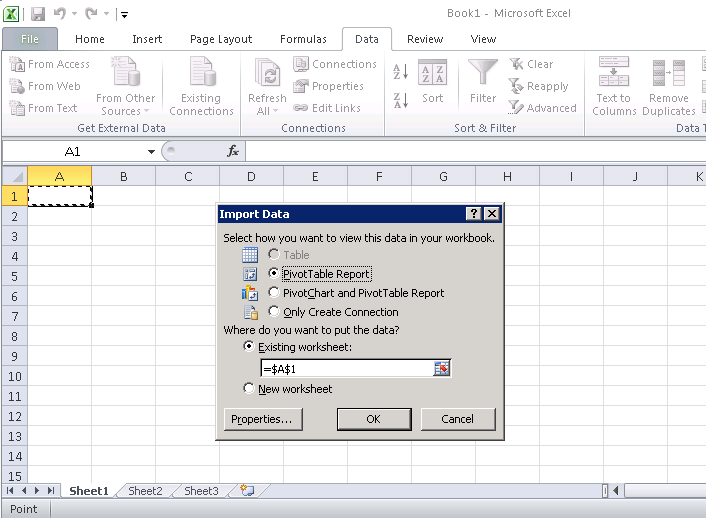
This brings up the data import wizard which asks if you want to create a report, a chart and a report or just a connection. You can also choose where these datasets would be placed in your excel.
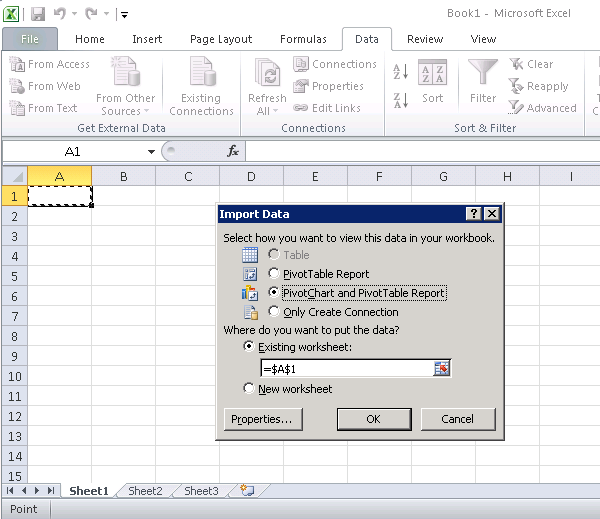
In this example we select the “Chart and Report” radio button as shown below. Press Ok to confirm.
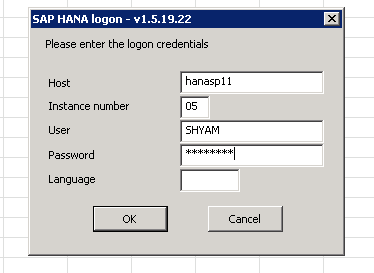
Provide your SAP HANA system credentials when the below pop up comes on to your screen.
On the right side, you would see that the fields of our imported view are listed out. You can choose to have fields that are available as filters, “Value” fields which are basically fields with transaction data like numbers to be measured/analyzed, and “Axis Fields” which are basically our dimensions by which we analyze the transactions.
In our example, we drop SCORE to our “Values” pane, and we analyze the data by date and hence we drop this to the “Axis fields” pane and also we provide the filtering capability to this report by Employee ID which we thus drop to the “Report Filter” pane.
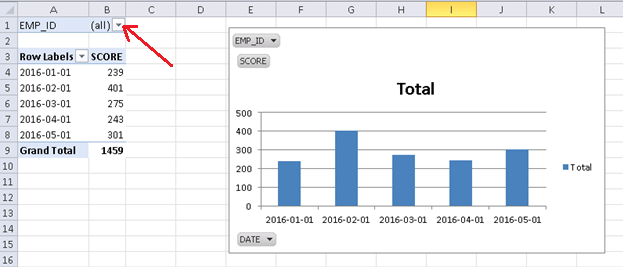
This now generates the below report magically. This looks decent enough for simple reporting purposes and also was really easy to create. Row 1 of the report contains the filter we added for the employee ID. Click on the down filter button on cell B1 to explore the filter values.
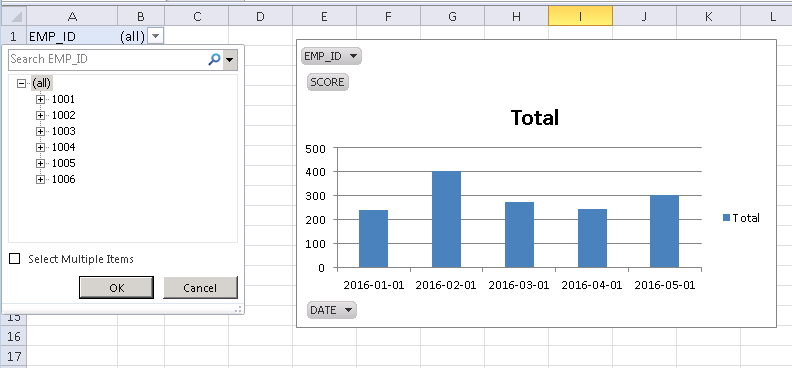
As seen below, all the employee ID values coming from the source SAP HANA view are listed out in the filters. Let’s select employee 1002 to check.
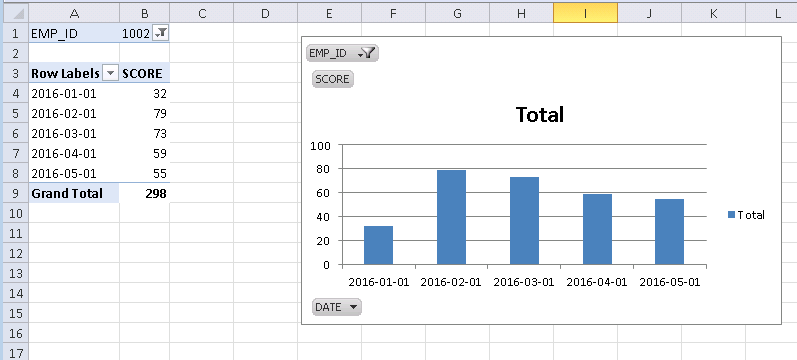
As seen below, the data now filtered only for this employee in the table as well as the chart.
The Excel on HANA reporting, as you must have understood is fairly simple to create and consume and most of you who understand excel may also know Pivot charts and Pivot tables which are used in excel of deeper data analysis. These charts and tables we just created were also Pivot tables and charts but with SAP HANA as a data source.
As always, I hope this tutorial was simple enough for everyone to understand the concept of Excel on HANA reporting. To keep this information free, please support this website by sharing it on social media to help us cover operating costs with incoming traffic.
Thank you for reading.

Hi Shyam,
I am trying to follow this tutorial but here in myyy excel am unable to see the option SAP HANA MDX Provider.
Could you please help me.Do i need to install any ad on to get this.
Am using Excel 2016
Hi Shekar you need to install hana client on Windows to get the MDX available as data source
Hi Richardo,
From where do i need to get that software.Could you please provide any link.
Shekar, I’m talking specifically for SAP Business One version for Hana, so you need to have a S-Number to download SAP HANA CLIENT from Download Center or Launchpad
Hi Richardo,
Now i somehow downloaded the trial version.
How can i install?
Do i need to install on top of excel or simply like normal software on windows system?
Hi Shyam,
Really very good stuff to refresh.
I have few questions on this Excel reporting on HANA.
As I have not worked excel reporting on HANA, I would like to clarify and correct me if I understood wrongly, once we prepare report on excel, do we provide CV to user/client or we save this as “.xls” file and upload it into user/clients folder ?
Depends on your client. In an ideal scenario, excel on hana and analysis for office are tools which should be used by the client (with a bit of training of course) so that they are not dependent on their IT teams for such small things. But we have seen in many cases that the client requests a basic report to be prepared and given to them and they do further analysis from there.
hi,
i try to insert a data in hana table from excel using button is it possitble.. help me to discover it
I am not sure what you mean by using a “button” but you can load data into HANA from flat files.
Check the below tutorial out –
http://teachmehana.com/loading-data-flat-file-sap-hana/
Hi,
why the table option is grayed out , can’t we pull raw data in table format instead of pivot?